The Consumer Price Index (CPI) rose 3.1% on a year-over-year basis in November, matching the 3.1% increase in October. In November, higher prices for travel tours put upward pressure on the CPI. Offsetting the upward pressure was slower price growth, on a year-over-year basis, for food alongside lower prices for cellular services and fuel oil. Excluding food and energy, the CPI increased 3.5% in November, following a 3.4% gain in October.
Canadians continued to feel the impact of higher prices for mortgage interest costs (+29.8%), food purchased from stores (+4.7%) and rent (+7.4%), which were the largest contributors to the year-over-year increase in November.
On a monthly basis, the CPI rose 0.1% in November, the same growth rate as in October (+0.1%). Gasoline prices fell to a lesser extent month over month in November (-3.5%) compared with October (-6.4%), putting upward pressure on the monthly CPI figure. On a seasonally adjusted monthly basis, the CPI rose 0.3% in November.
Chart 1
12-month change in the Consumer Price Index (CPI) and CPI excluding food and energy

Chart 2
Year-over-year slowdowns in food and shelter were offset by increases in recreation and clothing

Grocery prices continue to increase at a slower pace
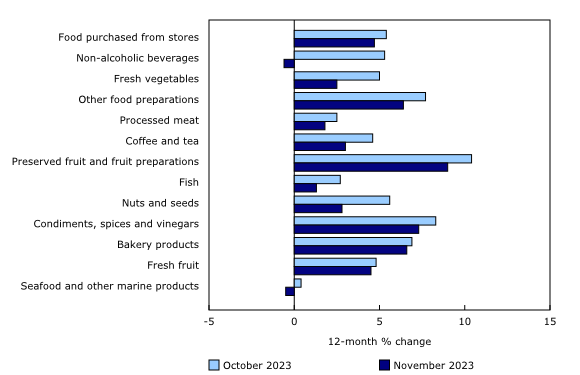
Prices for food purchased from stores continued to increase in November (+4.7%) but at a slower pace compared with October (+5.4%), with broad-based decelerations across food components. This marked the fifth consecutive month that grocery price growth slowed year over year, with prices for non-alcoholic beverages (-0.6%), fresh vegetables (+2.5%) and other food preparations (+6.4%) contributing the most to the slowdown. Food prices continue to be driven by a variety of international and domestic factors.
In contrast, prices for meat (+5.0%), preserved vegetables and vegetable preparations (+5.8%) and sugar and confectionery (+8.3%) increased at a faster pace on a year-over-year basis in November compared with October.
Chart 3
Broad-based year-over-year slowdowns across the food component

Prices for services remain elevated in November
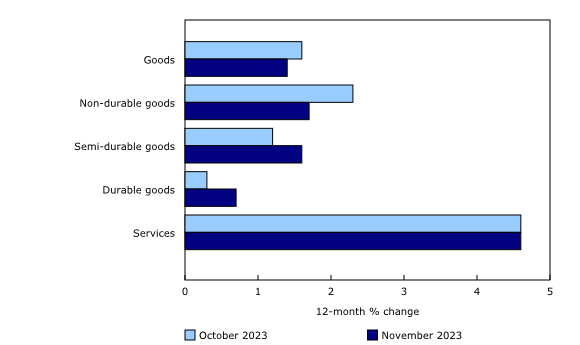
Prices for services remained elevated in November, rising 4.6% year over year, unchanged from October (+4.6%). Prices for travel tours accelerated on a year-over-year basis in November (+26.1%) compared with October (+11.3%), mainly attributable to events held in destination cities in the United States during November.
Offsetting the acceleration in travel tours was a decline in prices for cellular services. Consumers who signed on to a cell phone plan in November paid 22.6% less than those who did so in November 2022, as a variety of promotions across the industry, ahead of Black Friday, offered reduced prices for cellular phone plans, as well as bonus data.
Chart 4
Prices for services increase more than prices for goods

Shrinkflation info-sheet
Statistics Canada has released an info-sheet, “Measuring pure price change: Exploring Shrinkflation in the Consumer Price Index.”
Explore the Consumer Price Index tools
Check out Statistics Canada’s new Food Price Data Hub, which features a variety of food price related statistics, articles and tools.
To find a list of all recent publications regarding the Consumer Price Index (CPI), consult our Recent Analytical Products page.
Check out the Personal Inflation Calculator. This interactive calculator allows you to enter dollar amounts in the common expense categories to produce a personalized inflation rate, which you can compare to the official measure of inflation for the average Canadian household—the CPI.
Browse the Consumer Price Index Data Visualization Tool to access current (Latest Snapshot of the CPI) and historical (Price trends: 1914 to today) CPI data in a customizable visual format.
Regional highlights
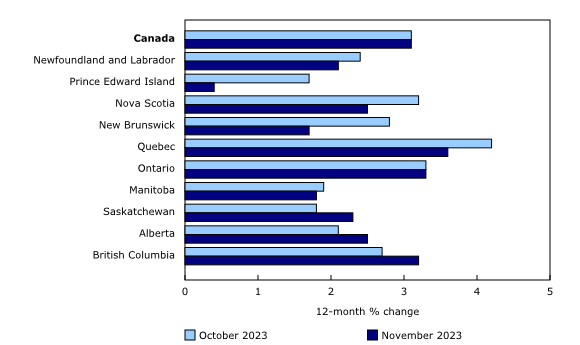
Year over year, prices increased in all provinces in November but rose at a slower pace compared with October in six provinces.
Chart 5
The Consumer Price Index rises at a slower pace in six provinces

Energy prices fall to a greater extent year over year
Energy prices fell to a greater extent year over year in November (-5.7%) compared with October (-5.4%), led by lower prices for fuel oil. Prices for fuel oil and other fuels fell 23.6% at the national level in November, after a 12.6% decline in October. The temporary suspension of the federal carbon levy on fuel oil contributed to the decline.
Electricity prices rose 8.2% year over year in November, following a 6.7% increase in October, moderating the decline in energy prices. The acceleration in electricity prices was largely the result of higher prices in Ontario (+7.0%), stemming from increased time-of-use rates in the province.


