The Consumer Price Index (CPI) rose 4.0% year over year in August, following a 3.3% increase in July. The headline acceleration was largely the result of higher year-over-year prices for gasoline in August (+0.8%) compared with July (-12.9%). Excluding gasoline, the CPI rose 4.1% in August, matching the 4.1% increase in July.
In addition to facing higher energy prices, Canadians paid more for rent and mortgage interest in August. Moderating the all-items CPI were declines in prices for travel-related services and a smaller increase in food prices compared with the previous month.
On a monthly basis, the CPI was up 0.4% in August, following a 0.6% gain in July. The monthly slowdown was mainly driven by travel tours (-6.4%) and air transportation (-6.9%), as prices fell month over month following the peak of summer travel demand in July. On a seasonally adjusted monthly basis, the CPI rose 0.6%.
Chart 1
12-month change in the Consumer Price Index (CPI) and CPI excluding gasoline

Chart 2
Price growth remains unchanged in the “all-items excluding gasoline” special aggregate

Chart 3
Acceleration in headline inflation led by transportation and shelter components

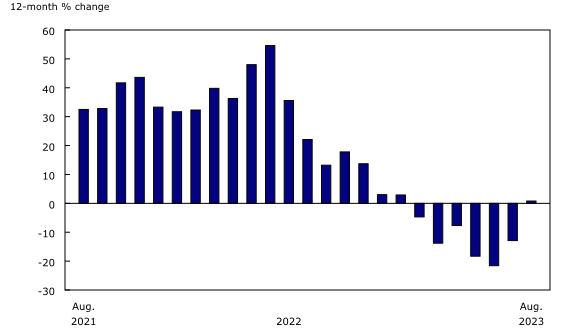
Gasoline prices increase year over year, the first yearly gain since January 2023
Gasoline prices rose 0.8% year over year in August, the first yearly increase since January 2023, after falling 12.9% in July. The year-over-year gain in the gasoline index was partly driven by a base-year effect, as prices fell 9.6% month over month in August 2022, resulting from higher global oil production and lower refining margins.
On a monthly basis, gasoline prices rose 4.6%, also contributing to the year-over-year increase in August 2023. The month-over-month gain was mainly the result of higher prices for crude oil following production cuts from major oil-producing countries.
Chart 4
Gasoline prices increase on a year-over-year basis for the first time since January 2023

Shelter prices accelerate, led by rent
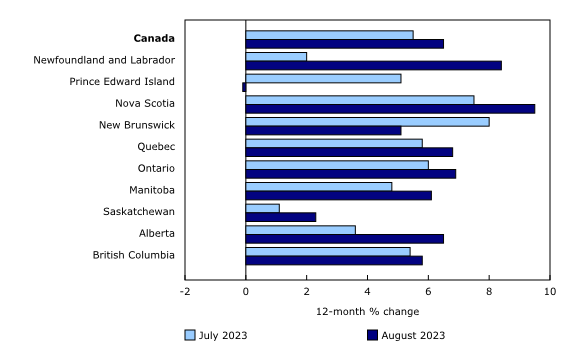
Shelter prices were up 6.0% on a year-over-year basis in August, after increasing 5.1% in July. Faster growth in shelter prices was led by the rent index, which rose 6.5% year over year nationally, after a 5.5% gain in July. Among other factors, a higher interest rate environment, which may create barriers to homeownership, put upward pressure on the index. While rent prices accelerated in eight provinces, those with the fastest price growth were Newfoundland and Labrador (+8.4%), Alberta (+6.5%), Nova Scotia (+9.5%) and Manitoba (+6.1%).
The mortgage interest cost index also contributed to the acceleration in shelter prices, rising at a slightly faster pace in August (+30.9%) compared with July (+30.6%).
Chart 5
Rent prices accelerate in eight provinces

Price growth for groceries slows, but remains elevated
Although year-over-year price growth for groceries slowed in August, price levels remained elevated. On a year-over-year basis, prices for food purchased from stores rose 6.9% in August compared with an 8.5% increase in July. On a monthly basis, prices for groceries were down 0.4% in August.
Prices for fresh fruit (+0.2%), cereal products (+9.8%), and fresh or frozen chicken (+8.9%) increased at a slower year-over-year pace in August compared with July, contributing to the deceleration in grocery prices. Conversely, consumers paid more for fresh or frozen beef (+11.9%), coffee and tea (+9.0%), as well as for sugar and confectionery (+10.9%).
Chart 6
Prices accelerate for some food products while others decelerate

Explore the Consumer Price Index tools
Check out the Personal Inflation Calculator. This interactive calculator allows you to enter dollar amounts in the common expense categories to produce a personalized inflation rate, which you can compare to the official measure of inflation for the average Canadian household—the Consumer Price Index (CPI).
Visit the Consumer Price Index portal to find all CPI data, publications, interactive tools and announcements highlighting new products and upcoming changes to the CPI in one convenient location.
Browse the Consumer Price Index Data Visualization Tool to access current (Latest Snapshot of the CPI) and historical (Price trends: 1914 to today) CPI data in a customizable visual format.
Regional highlights
Year over year, prices rose at a faster pace in August compared with July in every province.
Chart 7
The Consumer Price Index rises at a faster pace in all provinces

Energy prices increase the most in Alberta
Among the provinces, energy prices rose the most in Alberta, increasing 13.3% year over year in August, following a 7.7% decline in July. Along with gasoline, prices for natural gas and electricity contributed to the acceleration amid high summer demand.
In Alberta, natural gas prices fell to a lesser extent on a year-over-year basis in August (-12.5%) compared with July (-32.7%), putting upward pressure on the index.
Following a large price increase in July, electricity prices rose 121.7% year over year in August. During the period of high demand in the summer of 2022, provincial rebates kept prices lower for consumers. These rebates were gradually phased out and ended in spring 2023.


