The rate of consumer inflation continued to rise, reaching 8.1% year over year in June, following a 7.7% gain in May. The increase was the largest yearly change since January 1983. The acceleration in June was mainly due to higher prices for gasoline, however, price increases remained broad-based with seven of eight major components rising by 3% or more.
Excluding gasoline, the CPI rose 6.5% year over year in June, following a 6.3% increase in May.
On a monthly basis, the CPI rose 0.7% in June, following a 1.4% increase in May. On a seasonally adjusted monthly basis, the CPI was up 0.6%.
On average, prices rose faster than hourly wages, which increased 5.2% in the 12 months to June, based on data from the Labour Force Survey.
Year-over-year price growth for gasoline remains elevated
On a year-over-year basis, consumers paid 54.6% more for gasoline in June following a 48.0% increase in May, contributing the most to headline consumer inflation.
Prices at the pump rose 6.2% month over month in June, following a 12.0% increase in May. Gas prices largely followed crude oil prices, which peaked in the first week of June with higher global demand amid the easing of COVID-19 public health restrictions in China, the largest importer of crude oil. Crude oil prices eased in the remaining weeks of June amid slowing demand worldwide related to concerns of a global economic slowdown.
Prices for passenger vehicles rise
The purchase of passenger vehicles index rose 8.2% on a year-over-year basis in June following a 6.8% increase in May. Demand for passenger vehicles continues to outpace supply as a result of the ongoing semi-conductor shortage, putting upward pressure on prices. On a monthly basis, prices for passenger vehicles rose 1.5% in June, as prices for new vehicles (+1.6%) and used vehicles (+1.3%) increased. Month over month, prices for new vehicles rose at a faster pace than the 0.1% increase in May, due, in part, to the higher availability of new model-year vehicles.
Introduction of used vehicle prices
With the introduction of used vehicle prices in the calculation of the May CPI, two new series have been published: purchase of new passenger vehicles (2022-04=100) and purchase of used passenger vehicles (2022-04=100). Both price index series are available starting April 2022 and are published at the national level.
For more information, consult the technical paper entitled “Measuring price change for used vehicles in the Canadian Consumer Price Index.”
Chart 3
Similar increases in new and used passenger vehicle prices on a monthly basis

Prices for services remain elevated
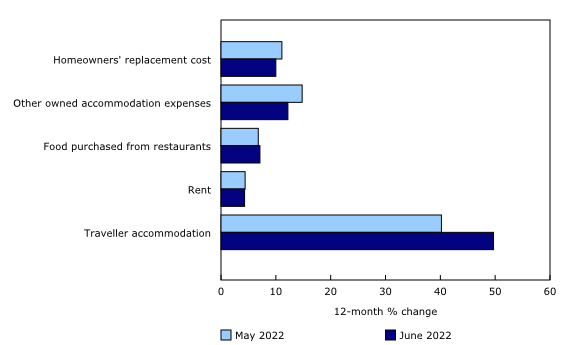
Prices for services rose 5.2% year over year in June. Homeowners’ replacement cost, other owned accommodation expenses, food purchased from restaurants, rent, and traveller accommodation contributed to the year-over-year increase.
Chart 4
Shelter services contributing the most to service inflation

Shelter costs decelerate with other owned accommodation expenses, moderated by mortgage interest cost
Other owned accommodation expenses rose less year over year in June (+12.2%) than in May (+14.8%), driven by the first month-over-month decrease since August 2019. This reflects lower real estate commissions as housing prices ease from early 2022 highs. The homeowners replacement cost index also increased at a slower pace year over year in June (+10.0%) compared with May (+11.1%), further moderating the increase in the shelter index.
The mortgage interest cost index continued to decrease at a slower pace on a year-over-year basis, down 0.6% in June following a 2.7% decline in May, putting upward pressure on the all-items CPI. This was driven by the largest month-over-month increase (+1.4%) since September 1982, amid higher bond yields and a higher interest rate environment.
Infographic 1
Homeowners’ replacement cost and other owned accommodation expenses increase at a slower pace and mortgage interest cost decreases at a slower pace year over year

Traveller accommodation and air transportation prices continue to rise at a faster pace
The easing of public health measures and the increase in tourism which followed has led to higher demand for travel-related services. Travellers across the country faced higher prices for accommodation (+49.7%) compared with June 2021, with prices rising the most for consumers in Ontario (+68.0%). The return of sporting events, festivals and other large in-person gatherings has resulted in higher demand for accommodation, particularly in major urban centres.
Prices for air transportation rose 6.4% month over month in June, following a 0.8% decline in May. Air travel has continued to increase amid loosening COVID-19 public health restrictions, with pent-up demand heading into the summer travel season putting upward pressure on prices.
Regional highlights
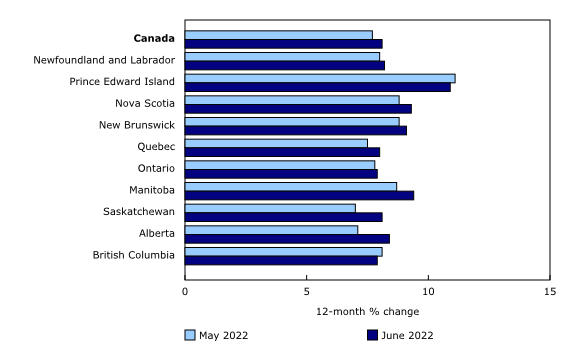
On a year-over-year basis, prices rose more in June than in May in eight provinces. Price growth was fastest in the Prairie provinces as gasoline prices accelerated the most in these provinces.
Chart 5
The Consumer Price Index rises at a faster pace in eight provinces

Energy prices rise in Alberta
Consumers in Alberta paid 54.6% more for natural gas year over year in June. Natural gas prices were pushed higher amid a combination of low supply in Canada as well as higher demand in Canada and the United States. Higher global prices associated with supply uncertainty related to Russia’s invasion of Ukraine have also contributed upward pressure on natural gas prices in Alberta.
Similarly, electricity prices in Alberta rose 35.6% on a year-over-year basis in June, compared with a 21.1% increase in May. Over half of the electricity used in Alberta is produced from natural gas.


