Employers in Canada were actively seeking to fill 959,600 vacant positions in the third quarter, down 3.3% from the record high reached in the second quarter (992,200). The number of job vacancies in the third quarter remained elevated; it was 8.3% higher than in the third quarter of 2021 and 72.7% higher than in the first quarter of 2020 (unless otherwise stated, this release presents seasonally adjusted data).
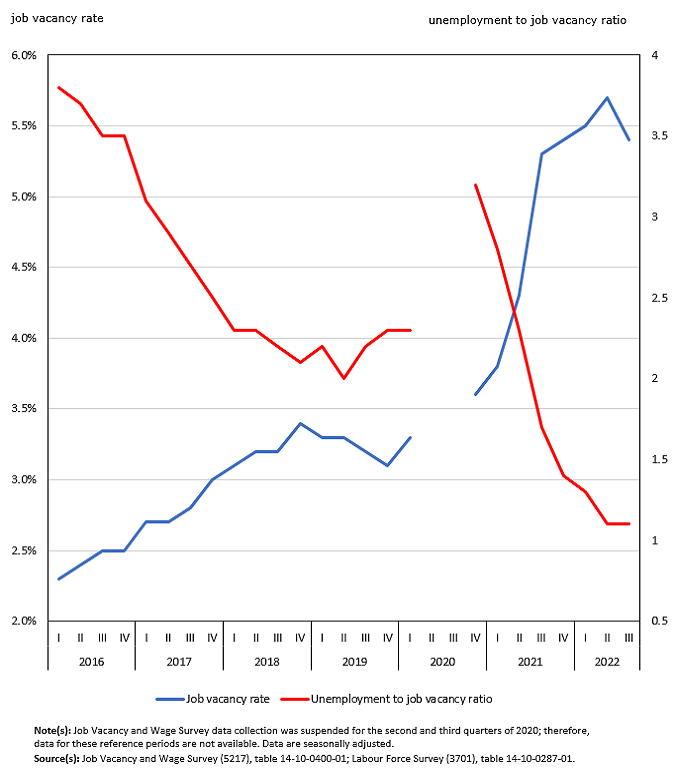
The job vacancy rate—which corresponds to the number of vacant positions as a proportion of total labour demand (the sum of filled and vacant positions)—was 5.4% in the third quarter of 2022, down from 5.7% in the second quarter. It was up from 3.3% in the first quarter of 2020 at the onset of the COVID-19 pandemic.
There was an average of 1.1 unemployed persons for each job vacancy in Canada in the third quarter of 2022, similar to the record low reached in the second quarter. In comparison, there was an average of 2.3 unemployed persons for each job vacancy in the first quarter of 2020. The unemployment to job vacancy ratio has declined steadily since the first quarter of 2016, along with the increase in the job vacancy rate.
Infographic 1
The unemployment to job vacancy ratio stabilizes as the job vacancy rate decreases
Changes in job vacancy levels and rates differ across provinces
Job vacancies decreased in the third quarter in Quebec (-6.7% to 232,400), British Columbia (-4.7% to 155,400) and Ontario (-3.6% to 364,000). At the same time, the number of vacancies was up in Manitoba (+10.7% to 32,400) and Saskatchewan (+7.5% to 24,300), while it was relatively stable in the other provinces.
Economic regions with large proportional decreases in vacancies included Lanaudière (-25.1% to 8,200), Outaouais (-16.3% to 6,900) and Chaudière-Appalaches (-12.3% to 11,800) in Quebec, and Stratford–Bruce Peninsula (-14.7% to 8,000) in Ontario.
British Columbia (6.2%) and Quebec (5.8%) continued to have the highest job vacancy rates among the provinces in the third quarter, as has been the case since the second quarter of 2019. In British Columbia, the economic region of North Coast and Nechako (7.9%) recorded the highest job vacancy rate, while the economic region of Lower Mainland–Southwest (5.8%) recorded the lowest. In Quebec, the job vacancy rate was highest in the economic region of Laurentides (6.9%) and lowest in the economic region of Gaspésie–Îles-de-la-Madeleine (4.5%).
Newfoundland and Labrador (3.8%) remained the province with the lowest job vacancy rate in the third quarter. Within this province, the job vacancy rate ranged from 3.3% in the economic region of Avalon Peninsula to 5.1% in the economic region of West Coast–Northern Peninsula.
Quebec (0.8) and British Columbia (0.9) also continued to have the lowest unemployment-to-job vacancy ratios of all provinces, while Newfoundland and Labrador (3.2) continued to have the highest ratio.
Job vacancies decrease in professional, scientific and technical services
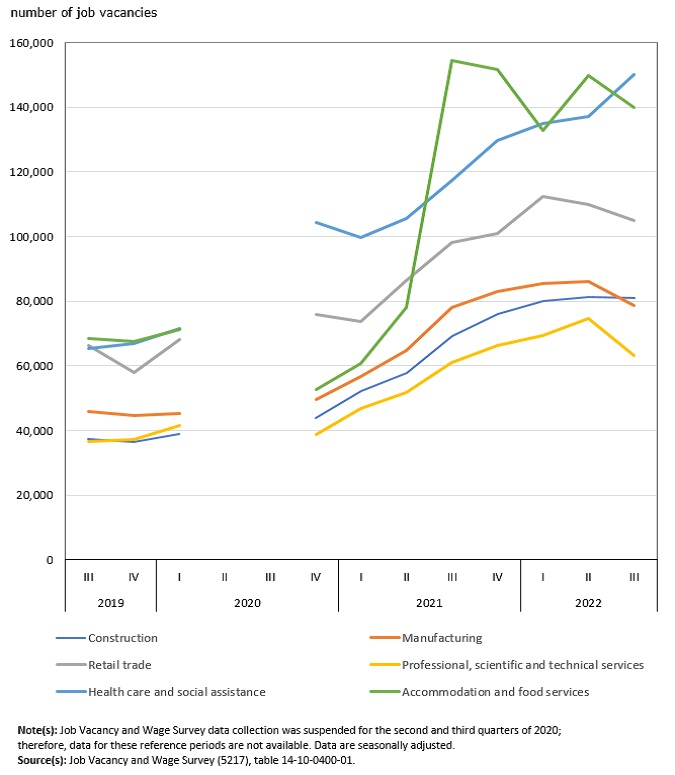
In professional, scientific and technical services, job vacancies declined 15.4% from the record high reached in the second quarter to 63,100 in the third quarter. This was the first decline in the sector since the fourth quarter of 2020.
Among the occupations prevalent in this sector, the number of job vacancies was down in professional occupations in natural and applied sciences (-17.4% to 42,100); technical occupations related to natural and applied sciences (-8.0% to 24,700); and professional occupations in business and finance (-9.4% to 27,400). Job vacancies among these occupational groups remained nearly 50% higher than in the first quarter of 2020 (not seasonally adjusted).
Though still elevated, job vacancies fall in accommodation and food services
There were 140,000 job vacancies in accommodation and food services in the third quarter, down 6.5% (-9,700) from the second quarter. As has been the case since the summer of 2021, the job vacancy rate in the accommodation and food services sector in the third quarter (10.0%) was highest among all sectors, despite the decline in that quarter.
Job vacancies fall in manufacturing, retail trade, finance and insurance, and wholesale trade
In manufacturing, job vacancies declined 8.7% to 78,500 in the third quarter. This was the first decrease in this sector since the third quarter of 2019 (data on job vacancies were not collected in the second and third quarters of 2020). From the third quarter of 2019 to the third quarter of 2022, labour demand held steady as a decrease in payroll employment (-33,000) was offset by an increase in job vacancies (+32,500), resulting in an increase in the job vacancy rate from 2.8% in the third quarter of 2019 to 4.8% in the same quarter of 2022.
On a quarter-over-quarter basis, the number of job vacancies was also down in the third quarter in retail trade (-4.7% to 104,800), finance and insurance (-8.6% to 39,100) and wholesale trade (-7.1% to 35,000).
Job vacancies hold steady in construction
In construction, there were 81,100 vacant positions in the third quarter, virtually unchanged from the record high of the previous quarter. The job vacancy rate was 6.7% in the third quarter, up from 6.1% in the same quarter of 2021 as job vacancies growth (+17.4%) continued to outpace payroll employment growth (+6.4%).
Vacancies for electricians (+51.5%; +1,800), carpenters (+19.6%; +2,100) and construction trades helpers and labourers (+12.9%; +2,900) rose from the third quarter of 2021 (not seasonally adjusted).
New record high number of job vacancies in health care and social assistance
Job vacancies in healthcare and social assistance increased 9.5% (+13,000) to an all-time high of 150,100 in the third quarter.
While payroll employment in healthcare and social assistance was 3.0% (+65,700) higher in the third quarter than in the same quarter of 2021, total labour demand was up even further (+4.3%; +98,500) over this period, resulting in a large year-over-year increase (+28.0%; +32,900) in the number of job vacancies.
On a quarter-over-quarter basis, job vacancies rose in the third quarter for registered nurses and registered psychiatric nurses (+17.0% to 27,600); nurse aides, orderlies and patient service associates (+37.5% to 26,200); and licensed practical nurses (+20.7% to 13,100). Together, these occupations made up the majority (69.2%) of all vacancies in health occupations in the third quarter (not seasonally adjusted).
Infographic 2
Job vacancy increase tapers off in many sectors
Continued labour market tightness drives up the proportion of long-term job vacancies
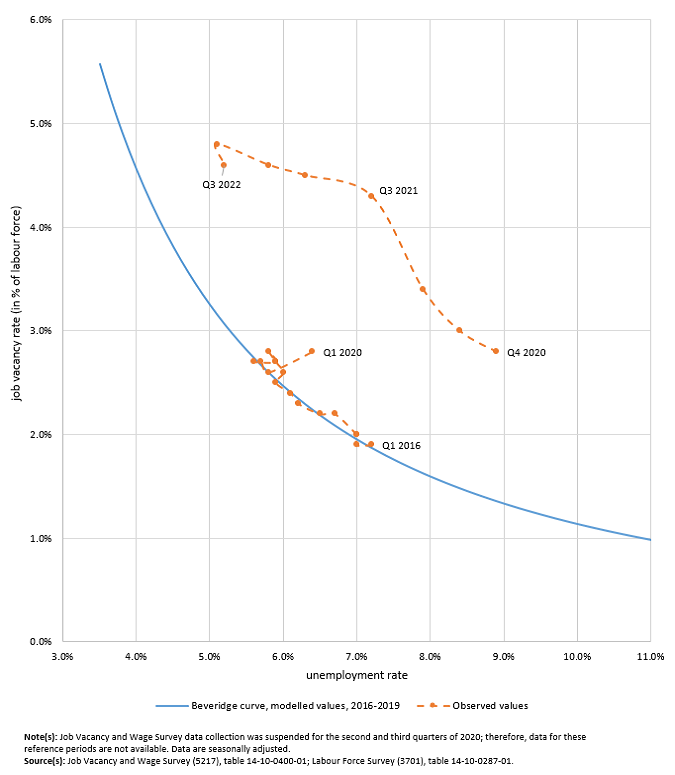
As highlighted in a recent analysis from the Bank of Canada, the relationship between unemployment and job vacancies can be summarized with the Beveridge curve, whereby the unemployment rate generally increases as job vacancy rate decreases, and vice versa. The second quarter of 2022 was marked by a record high job vacancy rate, accompanied by a record low unemployment rate. The decrease in the job vacancy rate in the third quarter, accompanied by a slight increase in the unemployment rate, resulted in a slight downward movement along a Beveridge curve.
Infographic 3
The Beveridge curve highlights recent trends in the job vacancy and unemployment rates
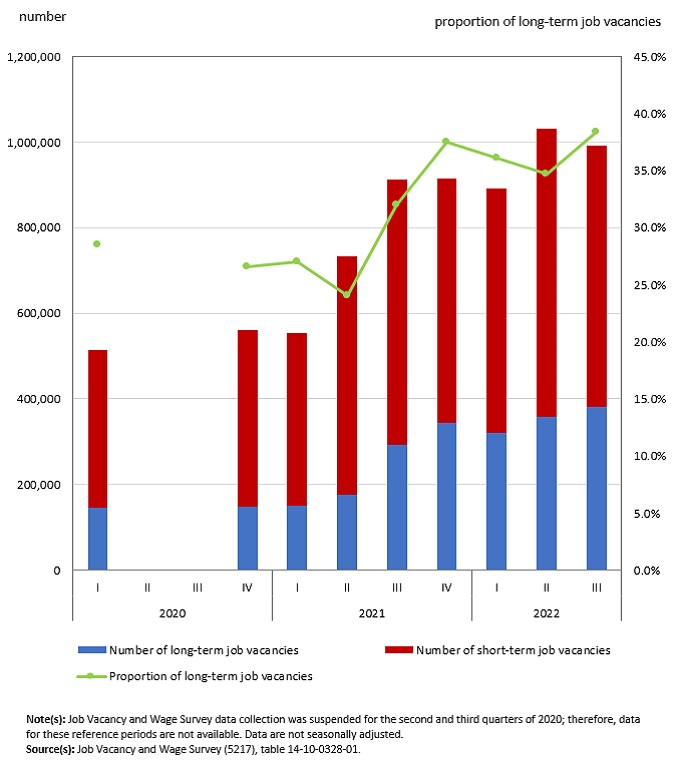
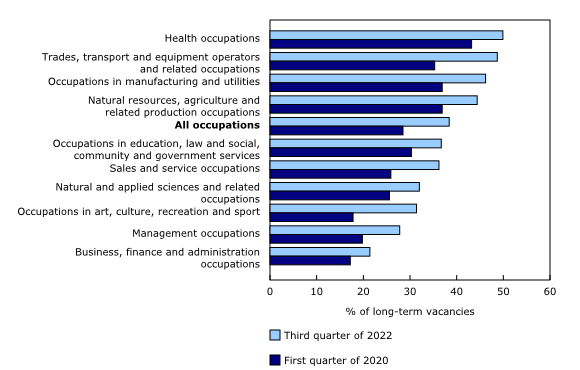
For a given job vacancy rate, a higher proportion of long-term vacancies (vacancies for which recruitment efforts have been ongoing for 90 days or more) indicate greater difficulties for employers to fill positions. From the first quarter of 2020 to the third quarter of 2022, the proportion of long-term job vacancies rose from 28.5% to 38.4% (not seasonally adjusted).
Infographic 4
The proportion of long-term job vacancies increases since the first quarter of 2021
Among health occupations, almost half (49.9%) of all job vacancies had remained unfilled for 90 days or more, the largest proportion of any broad occupational group. Since the first quarter of 2020, the proportion of long-term job vacancies increased in professional occupations in nursing (+10.8 percentage points to 53.5%), professional occupations in health (except nursing) (+5.0 percentage points to 51.1%) and technical occupations in health (+8.0 percentage points to 48.2%), while it was little changed in assisting occupations in support of health services (47.9%) (not seasonally adjusted).
Chart 1
Health occupations have the highest proportion of long-term vacancies in both the first quarter of 2020 and the third quarter of 2022
Offered wages increase markedly in 10 of 40 broad occupation groups
Faced with a tight labour market and hiring difficulties, some employers respond by raising the offered wages of their vacancies. Compared with the same quarter a year earlier, the average offered hourly wage increased by 7.5% to $24.20 in the third quarter. In comparison, average hourly wages of all employees (measured in the Labour Force Survey) rose 5.3% over the same period (data used in this section is not seasonally adjusted).
Part of this increase was due to a shift in the relative composition of job vacancies from lower-offered-wage to higher-offered-wage occupations. Using a method that holds the composition of job vacancies by occupation at the average of the third quarter of 2021, year-over-year offered wage growth would have been 5.5% in the third quarter of 2022.
On a year-over-year basis, the increase in average offered hourly wage in the third quarter matched or exceeded the national average (+7.5%) in 10 of the 40 broad national occupational classification groups, representing 25.4% of total vacancies. Broad occupations with notably higher than the average increases in offered wages included middle management occupations in trades, transportation, production and utilities (+10.8% to $41.40); assisting occupations in support of health services (+10.7% to $22.45); assemblers in manufacturing (+10.4% to $20.05); and processing and manufacturing machine operators and related production workers (+10.2% to $20.20). In contrast, care providers and educational, legal and public protection support occupations (+2.5% to $19.80); office support occupations (+3.1% to $21.20); and harvesting and landscaping and natural resources labourers (+3.8% to $19.85) recorded the lowest growth rates in offered wages.


