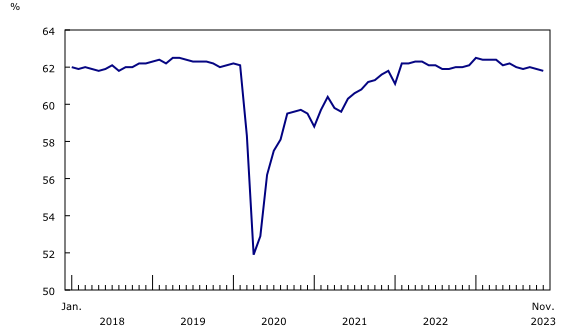
Employment was little changed in November (+25,000; +0.1%) and the employment rate fell 0.1 percentage points to 61.8%, as growth in the population continued to outpace employment growth.
The unemployment rate rose 0.1 percentage points to 5.8%, continuing an upward trend observed since April.
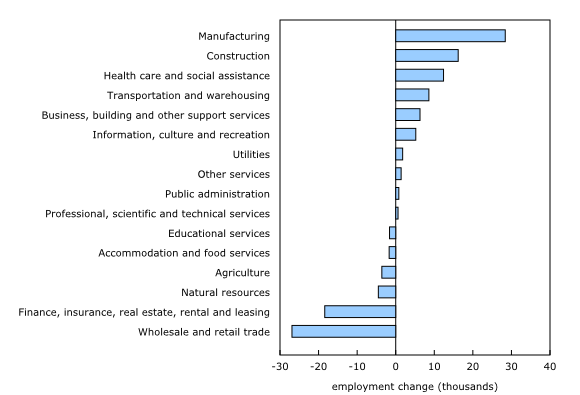
Employment increased in manufacturing (+28,000; +1.6%) and construction (+16,000, +1.0%). There were declines in wholesale and retail trade (-27,000; -0.9%) and finance, insurance, real estate, rental and leasing (-18,000; -1.3%).
Employment increased in New Brunswick (+2,400; +0.6%) and declined in Prince Edward Island (-1,300; -1.4%). Employment was little changed in all other provinces.
Among Canada’s 20 largest census metropolitan areas (CMAs), St. Catharines–Niagara and Oshawa recorded the largest unemployment rate increases from April to November (three-month moving averages).
Total hours worked fell 0.7% in November and were up 1.3% on a year-over-year basis.
On a year-over-year basis, average hourly wages rose 4.8% (+$1.57 to $34.28) in November, similar to the increase recorded in October (not seasonally adjusted).
Most immigrants who had arrived in the previous five years faced challenges finding work related to their post-secondary credentials or work experience acquired abroad (population in the labour force aged 15 to 69, not seasonally adjusted).
Employment little changed in November for second consecutive month
Employment was little changed in November (+25,000; +0.1%), the second consecutive month of little change. The employment rate—the proportion of the working-age population that is employed—fell 0.1 percentage points to 61.8% in the month, while the population aged 15 and older in the Labour Force Survey (LFS) grew by 78,000 (+0.2%).
The employment rate has decreased in four of the past five months, and has generally trended down since January 2023, when it reached a recent high of 62.5%.
The number of private sector employees rose by 38,000 (+0.3%) in November, the first increase since June. Meanwhile, the number of self-employed workers decreased by 25,000 (-0.9%), partly offsetting cumulative increases of 76,000 (+2.9%) in August and September. The number of public sector employees was little changed in November, but was up by 98,000 (+2.3%) from June.
Chart 1
Employment rate on downward trend since January as population growth exceeds employment

Employment rate falls among core-age men, continuing downward trend since June
Employment held steady for core-aged (25 to 54 years old) men and women in November. Among women in this age group, an increase in full-time work (+34,000; +0.6%) was partially offset by a decrease in part-time work (-21,000; -2.1%). Overall employment was little changed for youth and older workers in November.
In November, the employment rate among core-age men declined by 0.2 percentage points to 87.3%. The employment rate for core-aged men has trended down in recent months, declining 0.9 percentage points from a recent peak of 88.2% observed in June. The employment rate of core-aged women was little changed at 81.6% in November, but has trended downward throughout most of the year from its record high of 82.2% in January.
The employment rate of young women (aged 15 to 24) fell 0.6 percentage points to 56.4% in November, bringing the cumulative decline since August to 2.7 percentage points. The employment rate of young men (aged 15 to 24) was 56.5% in November, down 0.5 percentage points from October and down 1.7 percentage points from July.
Among women aged 55 and older, the employment rate rose 0.2 percentage points to 30.4% in November, while for men it held steady at 40.6%.
Unemployment rate increases for a second consecutive month, continuing upward trend since April
The unemployment rate rose 0.1 percentage points to 5.8% in November, bringing the cumulative increase since April 2023 to 0.8 percentage points.
Although the unemployment rate has trended up for all major age groups, increases have been more pronounced among youth. From April to November, the unemployment rate increased by 2.0 percentage points (to 11.6%) among youth aged 15 to 24. Over the same period, it increased by 0.6 percentage points among people aged 25 to 54 (to 4.9%) and by 0.7 percentage points among people aged 55 and older (to 4.6%).
Chart 2
Unemployment rate reaches 5.8%, up 0.8 percentage points from April

More unemployed due to layoff compared with a year earlier
Compared with a year earlier, unemployed people in November were more likely to have been laid off from their previous job, reflecting more difficult economic and labour market conditions in 2023 compared with 2022.
Of those who were unemployed in November and had worked in the previous year, more than two-thirds (68.7%) had been laid off from their previous job, compared with 62.6% in November 2022. In comparison, less than one-third (31.3%) of the unemployed in November 2023 who had worked in the previous year had voluntarily left their job, down from 37.4% in November 2022 (not seasonally adjusted).
Employment gains in manufacturing and construction
Employment increased by 28,000 (+1.6%) in manufacturing in November, offsetting a decline of 19,000 (-1.0%) in October. Employment in this sector was up by 2.4% (+43,000) on a year-over-year basis, in line with overall annual employment growth across all sectors (+2.5%; +499,000).
In construction, employment increased by 16,000 (+1.0%) in November, building on an increase of 23,000 (+1.5%) in October. While employment declined in construction through the spring and summer of 2023, gains in October and November brought employment levels in this sector to within 15,000 of the peak reached in January 2023. According to the most recent data on building construction, investment in building construction, in particular residential building construction, trended down for most of 2023, before partially rebounding in August and September.
Employment declined by 27,000 (-0.9%) in wholesale and retail trade in November, adding to a drop of 22,000 (-0.7%) in October. As of November, employment in the industry was at its lowest since December 2022.
In finance, insurance, real estate, rental and leasing, employment fell by 18,000 (-1.3%) in November. Since July, employment in this industry has declined by 63,000 (-4.4%), the steepest decrease of any industry over the period.
Chart 3
Employment increases in manufacturing and construction offset by declines in wholesale and retail trade and in finance, insurance, real estate, rental and leasing in November

Employment up in New Brunswick in November, while Prince Edward Island records a decline
In November, employment rose in New Brunswick and declined in Prince Edward Island. All other provinces posted little change. For further information on key province and industry level labour market indicators, see “Labour Force Survey in brief: Interactive app.”
Employment in New Brunswick increased (+2,400; +0.6%) in November, following an identical increase in October (+2,400; +0.6%). In the 12 months to November 2023, employment in the province increased by 15,000 (+4.0%). The unemployment rate stood at 6.4% in November, down 0.8 percentage points from November 2022.
Following successive monthly increases from June to September 2023 and little change in October, employment in Prince Edward Island declined (-1,300; -1.4%) in November. The unemployment rate rose by 1.9 percentage points to 8.1%.
Employment in Quebec was little changed in November, following a decrease in October (-22,000; -0.5%). The unemployment rate rose 0.3 percentage points to 5.2% in November, 1.3 percentage points above the record low of 3.9% reached in November 2022 and in January 2023.
Employment was little changed for the fifth consecutive month in Ontario in November. The employment rate in the province (61.3%) was down a full percentage point (-1.0%) from the recent high of 62.3% in April 2023. The unemployment rate stood at 6.1% in November, little changed in the month but up 1.2 percentage points from April.
Map 1
Unemployment rate by province and territory, November 2023

St. Catharines–Niagara and Oshawa record largest April-to-November unemployment rate increases
Among Canada’s 20 largest CMAs, the unemployment rate in November was highest in Windsor (7.6%), St. Catharines–Niagara (7.3%) and Oshawa (7.3%) and lowest in the CMAs of Québec (2.7%), Kelowna (3.9%) and Victoria (4.1%).
Mirroring the trend at the national level, the unemployment rate increased in 10 of these 20 CMAs from April to November, while in the other 10 CMAs the unemployment rate was little changed over the period. The largest increase was in St. Catharines–Niagara, where the unemployment rate in November (7.3%) was up 2.9 percentage points from April, followed by Oshawa, where the unemployment rate in November (also 7.3%) was up 2.7 percentage points from April.
Infographic 1
Unemployment rate in November highest in Windsor, St. Catharines–Niagara and Oshawa

In the Spotlight: Nearly 6 in 10 recent immigrants who are in the labour force faced challenges finding work in their field over the last two years
In recent years, record numbers of immigrants have arrived in Canada to seek job opportunities, to reunite with their families or to claim asylum as refugees. In 2021, the proportion of the population who were immigrants reached a historic high of 23.0%. From July 1, 2022, to July 1, 2023, immigrants and non-permanent residents have accounted for close to 98% of population growth.
Although immigrants play an increasingly large role in Canada’s labour market, many continue to face barriers integrating into the labour market, including those with post-secondary credentials or work experience acquired abroad. In November, supplementary questions were added to the LFS to better understand the labour market challenges experienced by newcomers.
Among recent immigrants (those who had arrived in Canada in the previous five years) who had work experience or post-secondary credentials from abroad, nearly 6 in 10 (58.2%) had faced difficulties finding work related to their foreign work experience or credentials in the past two years. In comparison, fewer than half (47.6%) of those who had arrived from 5 to 10 years earlier had faced such difficulties (population in the labour force aged 15 to 69, not seasonally adjusted).
The most common difficulties encountered by recent immigrants with credentials or experience were not having enough Canadian job experience (22.7%), having no connections in the job market (20.3%) and lacking enough references from Canada (18.5%).
In the Spotlight: Parents of young children more likely to have hybrid work arrangement or to work exclusively from home
After increasing markedly in the context of the COVID-19 pandemic, the share of workers who work exclusively from home has gradually declined since the winter of 2022, falling from 24.3% in January 2022 to 12.6% in November 2023 (population in the labour force aged 15 to 69, not seasonally adjusted).
In comparison, the share of workers that indicated that they usually worked exclusively at locations other than their home in November 2023 was just over three-quarters (75.7%), similar to August 2023 (76.1%), but up from January 2022 (72.1%).
Part of the return to in-person work has taken the form of hybrid arrangements, where workers usually work some hours at home, and some hours outside the home. The share of workers with hybrid arrangements has more than tripled since January 2022, rising from 3.6% to reach 11.7% in November 2023.
The prevalence of specific work arrangements can reflect a range of factors, including industry and occupational composition, and the specific circumstances of employers and workers. However, working from home and hybrid work can be appealing to parents, due to the time saved from commuting and the greater prevalence of flexible schedules. In November 2023, 3 in 10 (30.1%) parents with at least one child five years or younger worked exclusively from home or had a hybrid arrangement, including 33.2% of mothers and 27.4% of fathers with a child aged five or younger. In comparison, 23.5% of workers without a child five years or younger worked exclusively from home or had a hybrid work arrangement.
Table 1
Labour force characteristics by age group and sex, seasonally adjusted


